15 ChatGPT Prompts for Excel: Clean Data, Find Trends, and Make Better Decisions
A spreadsheet can contain thousands of rows and still leave you with the same question: what should I actually do with this data? ChatGPT can help inspect Excel files, write formulas, explain trends, suggest charts, and organize findings into a decision. But the prompt matters, especially when the data is messy or the answer has real business consequences.
This guide includes 15 copy-and-paste ChatGPT prompts for Excel and data analysis, organized from basic data preparation to decision-making. Every prompt includes the context to fill in and a validation step so you can check its results before relying on them.
ChatGPT supports spreadsheet uploads such as .xlsx and .csv for analysis, and supported environments may use Python to calculate statistics and create charts. Its exact file features vary by model, plan, account, and workspace settings. OpenAI Data Analysis documentation.
The best Excel prompt does not just ask for more charts. It defines the business question, the columns to inspect, the checks to perform, and the decision the analysis should support.
Quick Answer: What Are the Best ChatGPT Prompts for Excel?
The most useful ChatGPT prompts for Excel request a specific analytical outcome: check data quality, clean values without deleting evidence, build or debug a formula, calculate a well-defined KPI, investigate a change, flag anomalies, choose the right chart, or recommend next steps. State the relevant sheet, columns, time range, assumptions, and output format. Ask the model to show calculations and disclose uncertainty.
BUSINESS QUESTION
    +
SPREADSHEET / RELEVANT COLUMNS
    +
CALCULATIONS & QUALITY CHECKS
    +
OUTPUT FORMAT
    +
VERIFICATION / LIMITATIONS
    ↓
USEFUL ANALYSIS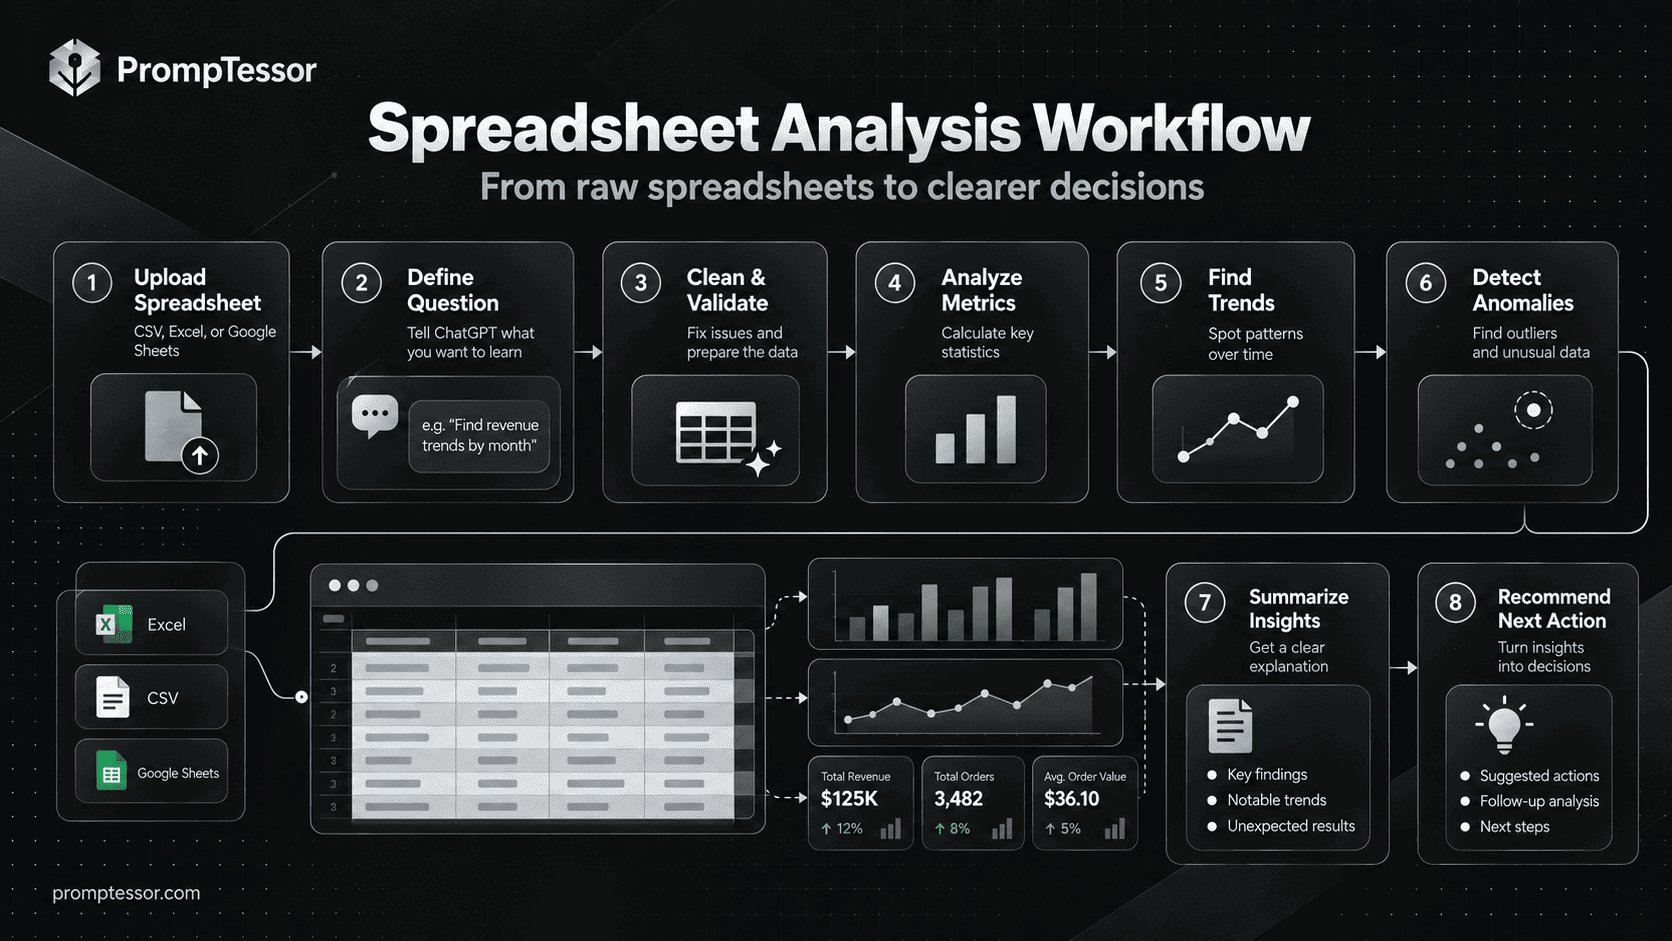
Can ChatGPT Analyze Excel Files?
Yes. You can upload common spreadsheet formats including .xls, .xlsx, and .csv, then ask ChatGPT questions about the actual data. Depending on the available tools, ChatGPT may use Python-backed calculations, tables, and charts. OpenAI Help Center.
There are two related workflows: (1) upload an Excel or CSV file into a ChatGPT conversation and analyze it there; or (2) use an enabled ChatGPT integration inside Excel or Google Sheets where supported. Do not assume the second workflow is installed just because you can upload files in ChatGPT. OpenAI Academy: Analyzing data with ChatGPT.
Prepare Your Workbook Before You Start
- Use descriptive headers in the first row and one record per row.
- Keep units, currencies, date definitions, and metric definitions clear.
- For multi-sheet workbooks, mention which sheets are relevant.
- Remove or anonymize personal, confidential, or restricted data when necessary; follow your organization’s data-handling policies.
- Save the original file before requesting cleaning or modifications.
- Confirm supported file access and permissions for your account.
For simple tasks, a small sample may be enough to generate a formula; to compute an actual answer, ChatGPT needs the relevant dataset. OpenAI Academy: Working with files.
How to Use These ChatGPT Excel Prompts
- Attach the workbook or paste the relevant rows. Do not expect ChatGPT to see a local file unless you share it.
- Choose the desired outcome. Start with data quality for unfamiliar datasets, then move toward KPIs, analysis, and decisions.
- Replace every placeholder such as
{metric},{sheet}, and{period}. - Request transparent calculations. For important numbers, ask for formulas, aggregation rules, row references, and checks.
- Verify and iterate. Spot-check source rows, compare totals, and refine the prompt when definitions are unclear.
For deeper guidance on turning one successful prompt into a reusable template, see Prompt Templates and Variables.
Data Preparation
Find issues and establish a trustworthy dataset before computing anything.
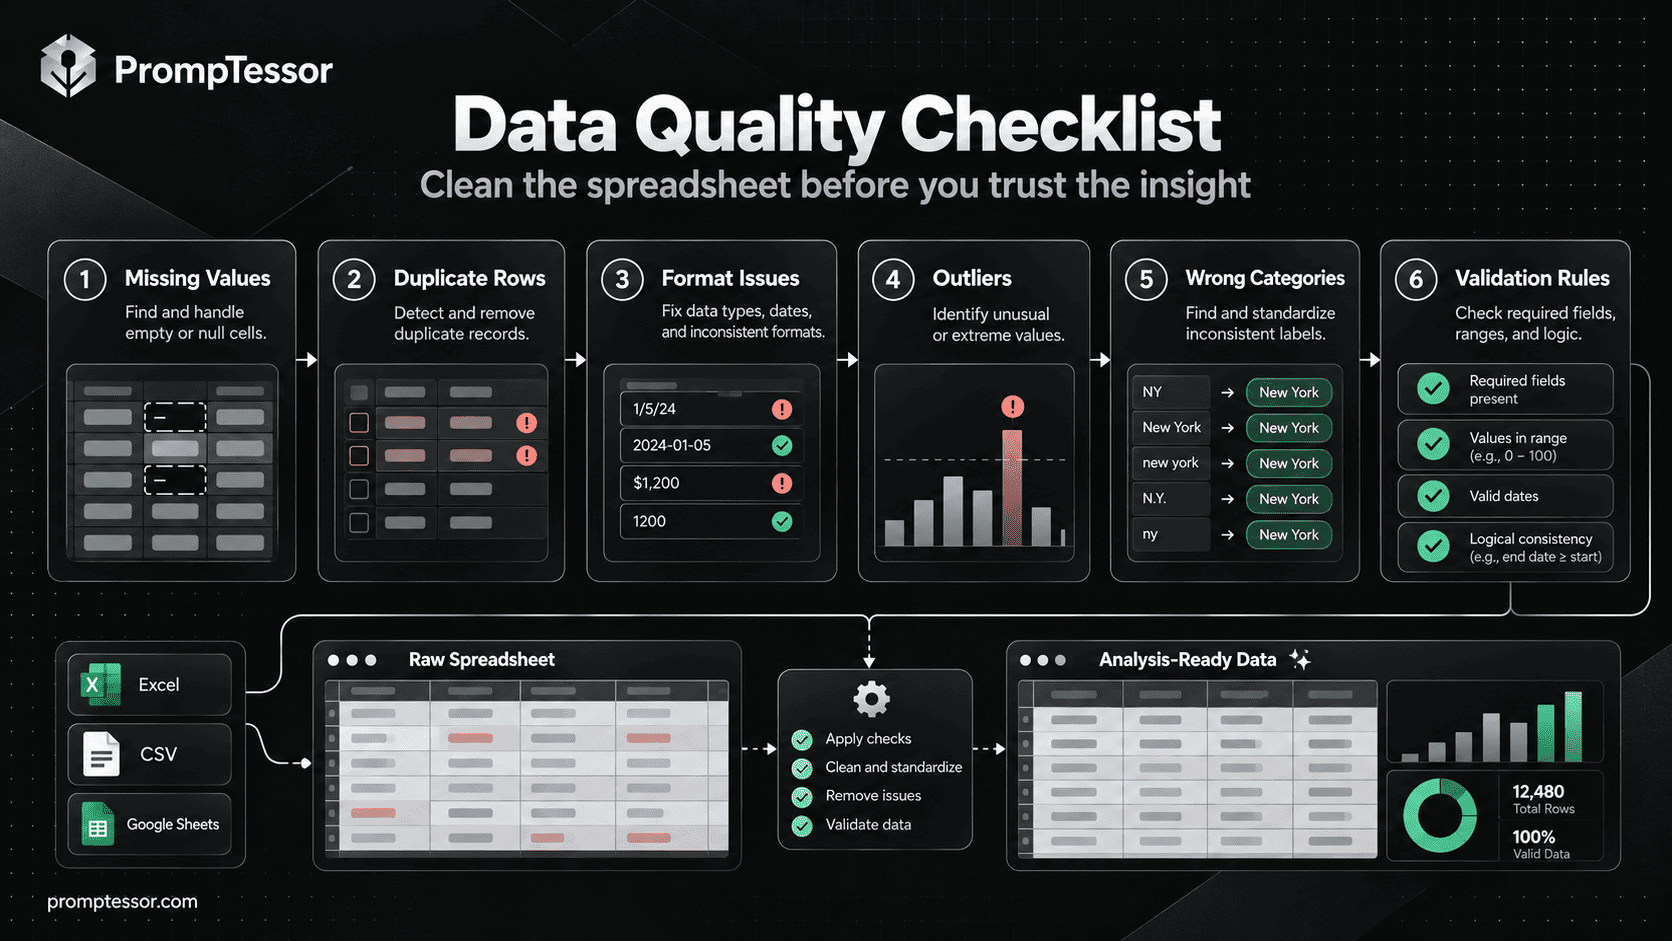
Prompt 1: Check Data Quality Before Analyzing
Best for: Start here if an export came from a CRM, sales platform, survey, or finance tool. Detect issues before they distort your conclusions.
Customize: Attach the spreadsheet and optionally identify the sheet or business-critical columns.
Copyable ChatGPT Prompt
Act as a data quality analyst. Inspect the attached Excel or CSV file before any business analysis.

Worksheet: {worksheet_name_or_all}
Important columns: {important_columns_or_infer}

1. List the sheets, column names, inferred types, row counts, and any ambiguities.
2. Check missing values, duplicate records, inconsistent categories, invalid dates, mixed numeric/text fields, and unusual outliers.
3. Distinguish genuine errors from values that are merely uncommon.
4. Quantify each issue: affected rows, percentage of rows, sample row identifiers, and business impact.
5. Recommend corrections but DO NOT modify the source file yet.

Output: a data quality table with Issue | Column/Rows | Count | Severity | Evidence | Proposed Fix, followed by questions that must be answered before cleaning. If you cannot inspect a field reliably, say so.
What to verify: Spot-check the row identifiers, confirm what counts as a true duplicate, and verify that legitimate zeros or blanks were not classified as errors.
Prompt 2: Clean Messy Spreadsheet Data Safely
Best for: Use this when you need a consistent dataset for reporting without losing track of what changed.
Customize: Specify the schema, valid categories, and whether cleaned-file export is available.
Copyable ChatGPT Prompt
Clean the attached spreadsheet for analysis while preserving the original data.

Worksheet: {worksheet}
Expected schema: {column_names_and_types}
Known valid categories: {valid_categories_or_unknown}

First, propose a cleaning plan. Standardize whitespace, dates, numeric formats, and category labels where mappings are unambiguous. Flag possible duplicates; do not remove them unless the duplicate rule is explicit. Never invent values for missing fields or silently delete rows.

If file editing is supported and I approve the plan, create a separate cleaned worksheet/file and a change log; otherwise provide reproducible Excel steps or Python code.

Output: original vs cleaned row counts, transformations table, ambiguous rows for human review, validation checks, and the cleaned artifact only if actually generated.
What to verify: Compare before-and-after totals, unique IDs, data types, and several random records; keep the untouched original.
Prompt 3: Standardize Columns and Combine Spreadsheet Exports
Best for: Helpful when monthly files or different tools use different field names and formats.
Customize: Attach multiple files or sheets and provide a preferred reporting schema.
Copyable ChatGPT Prompt
I have multiple spreadsheet exports that need one consistent schema.

Files/sheets: {files_or_sheet_names}
Canonical columns: {target_schema}
Join key if applicable: {join_key_or_none}

Inspect actual column names. Suggest a source-to-target mapping, including units, date formats, currencies, and category definitions. Identify columns with no safe equivalent and any one-to-many joins or duplicate keys.

Do not merge data until you show a preview mapping and list unresolved ambiguities. After I confirm, create a standardized table if tooling allows; otherwise provide explicit reproducible transformation steps.

Output: field-mapping table, validation checks, unmatched rows/columns, and a reconciliation summary of row counts and numeric totals.
What to verify: Review join cardinality, mismatched units, currency conversions, and whether records disappeared or multiplied.
Formulas & Calculations
Generate, debug, and validate the calculations behind your numbers.
Prompt 4: Generate Excel Formulas From Plain English
Best for: Turn a specific calculation requirement into an Excel formula with clear cell references.
Customize: Identify the worksheet structure, Excel version, and desired calculation.
Copyable ChatGPT Prompt
Act as an Excel formula specialist. Create a formula for this task:
{calculation_goal}

Worksheet layout: {sheet_name_and_columns}
Excel version: {version_or_unknown}
Example input rows: {optional_examples}

Use real cell references or structured table references based on the supplied layout. Prefer a straightforward formula compatible with my Excel version. If necessary, show a modern formula and a compatible alternative.

Return: (1) paste-ready formula, (2) where to paste it, (3) how it works, (4) how blanks, errors, dates, and zero denominators are handled, and (5) two hand-checkable test cases with expected results.

If exact references are missing, ask for them instead of inventing a worksheet structure.
What to verify: Paste into a copy of the workbook, test edge cases, and confirm separators and function availability for your Excel locale/version.
Prompt 5: Debug Broken Excel Formulas
Best for: Use this when you see #N/A, #VALUE!, #REF!, unexpected blanks, or a formula that returns the wrong number.
Customize: Paste the exact formula, sample inputs, expected result, and actual error.
Copyable ChatGPT Prompt
Debug this Excel formula without changing its intended business logic.

Formula: {exact_formula}
Cell/table layout: {relevant_columns_and_ranges}
Observed error or result: {actual_result}
Expected behavior: {expected_result}
Excel version/locale: {version_locale}

Identify the most likely root causes, including mismatched data types, relative vs absolute references, missing keys, range size differences, date parsing, and calculation settings.

Return: ranked hypotheses, tests to distinguish them, the corrected formula only when justified, and at least three test cases. Do not hide real missing data with IFERROR unless that behavior is explicitly appropriate.
What to verify: Compare results to known correct rows; confirm that error handling did not conceal bad data.
Prompt 6: Calculate KPIs and Percentage Changes Correctly
Best for: Build reliable metrics with explicit denominator choices and consistent period comparisons.
Customize: Provide KPI definitions and the columns containing dates, counts, and amounts.
Copyable ChatGPT Prompt
Analyze the attached spreadsheet and calculate these KPIs: {kpi_list}.

Business definitions: {kpi_definitions}
Date column: {date_column}
Comparison periods: {periods}
Segments: {segments_or_all}

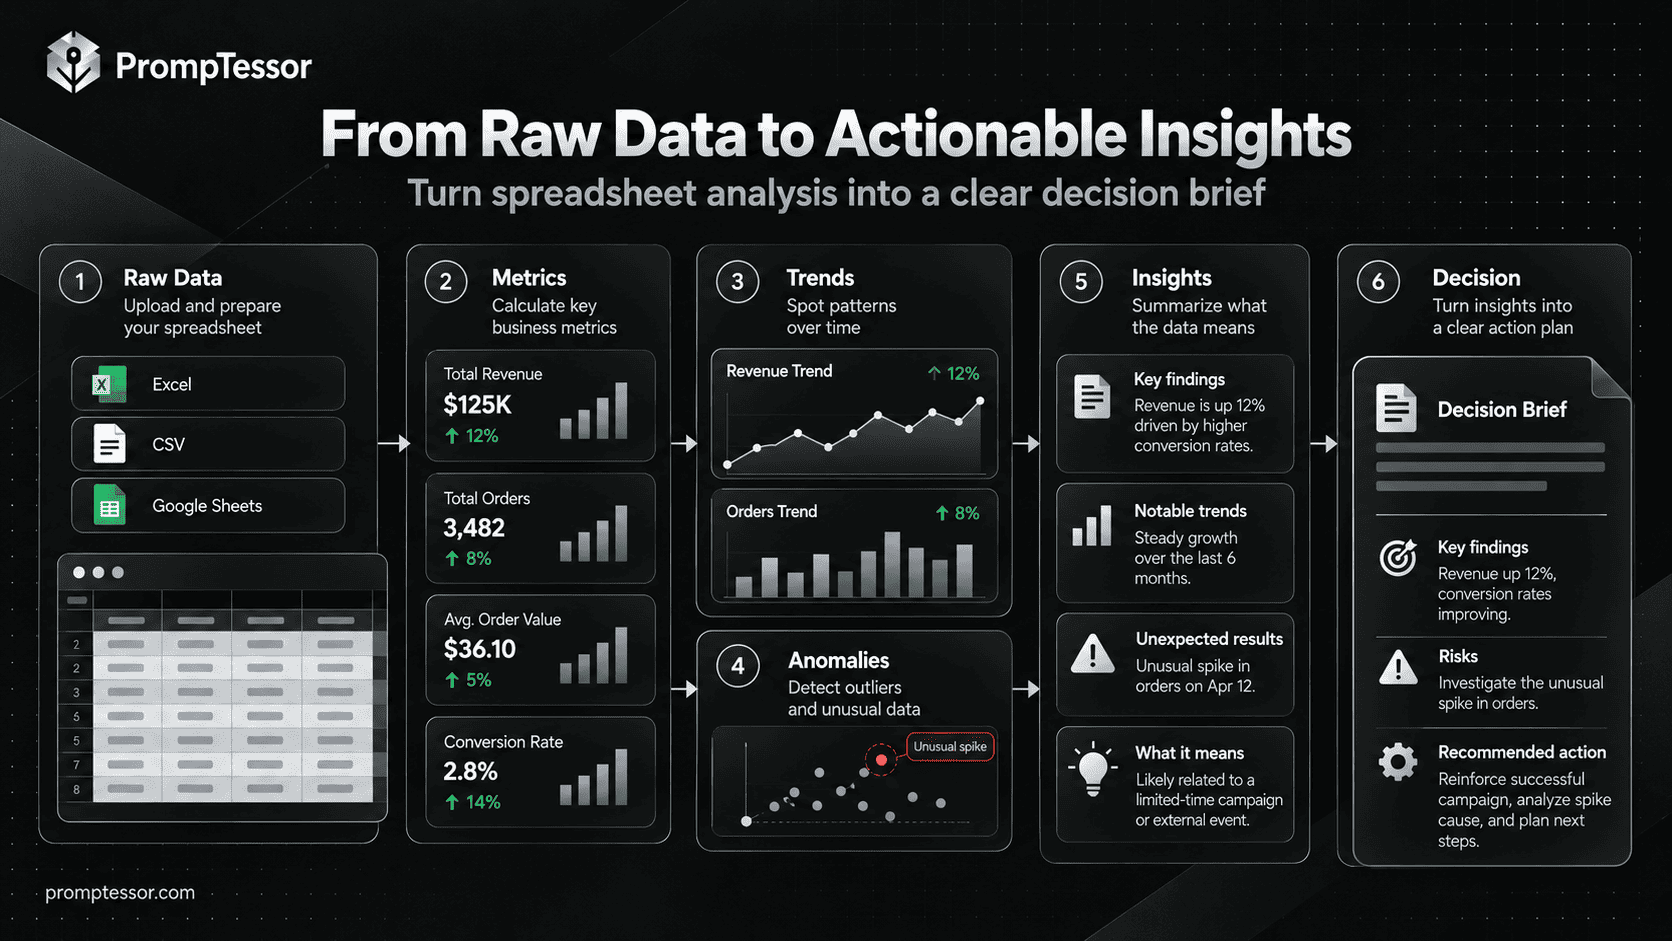
Before calculating, state the formula and denominator for each KPI. Then compute values from actual source rows. For period comparison, distinguish percentage change from percentage-point change; handle missing periods and zero denominators explicitly.

Output: KPI | Formula | Current | Previous | Absolute Difference | Percent or pp Change | Source Columns | Caveats. Show one manual calculation for a representative metric. Do not call a change significant without a suitable statistical test.
What to verify: Recalculate a sample KPI independently and check whether refunds, canceled orders, or incomplete dates change the denominator.
Analysis & Insights
Investigate movement, differences, and unusual observations without overstating causality.
Prompt 7: Find Trends and Seasonality in Excel Data
Best for: Answer whether movement is persistent, seasonal, or driven by one exceptional period.
Customize: Choose the metric, date grain, and analysis period.
Copyable ChatGPT Prompt
Find meaningful trends in the attached spreadsheet.

Metric: {metric}
Date column: {date_column}
Period: {start_to_end}
Grouping: {weekly_monthly_or_quarterly}

Check missing periods and date consistency first. Aggregate the metric correctly and quantify direction, magnitude, volatility, and any apparent seasonality. Compare with a relevant baseline where data permits.

Output: period-by-period table, 3 to 5 evidence-backed observations, recommended chart, and limitations. Separate observed patterns from hypotheses. If the history is too short to support a seasonality claim, say so.
What to verify: Inspect chart axes, aggregation logic, and missing periods; avoid labeling a handful of points a reliable forecast.
Prompt 8: Explain What Is Driving a Change
Best for: Go beyond “sales went down” to identify contributors that may merit follow-up.
Customize: Define the change metric, comparison periods, and segment columns.
Copyable ChatGPT Prompt
Investigate the change in {metric} between {period_a} and {period_b} using the attached dataset.

Relevant segments: {channels_regions_products_or_other}
Business context: {known_context_or_none}

Validate that both periods are comparable. Decompose the aggregate change into segment-level contributions where mathematically appropriate. Check volume, mix, rate, and data quality shifts.

Output: summary of the observed change, contribution table ranked by magnitude, 3 plausible explanations, evidence for and against each explanation, and specific tests to confirm causes. Do not mistake correlation or a mathematical contribution for causal proof.
What to verify: Confirm weighted vs unweighted averages and distinguish supported drivers from untested causal hypotheses.
Prompt 9: Detect Outliers and Anomalies Worth Investigating
Best for: Find suspicious spikes, duplicates, and unusual category behavior without equating all outliers with errors.
Customize: Specify the key metric and what a meaningful unusual event would look like.
Copyable ChatGPT Prompt
Review the attached spreadsheet for anomalies in {metric_or_columns} across {time_range_or_all}.

Relevant grouping: {grouping}
Expected business constraints: {limits_or_unknown}

Check basic data quality first. Flag unexpected spikes or drops, rare categories, duplicate patterns, abrupt shifts, and observations outside a reasonable baseline. Explain the detection method and threshold, and separate confirmed data errors from statistical outliers or legitimate business events.

Return: Row/Period | Metric | Expected Baseline | Observed | Why Flagged | Confidence/Limitations | Next Check. Include enough references to inspect the exact source rows. Do not edit or remove values.
What to verify: Verify each flagged case against source transactions and known events such as holidays, promotions, and reporting changes.
Prompt 10: Compare Customers, Products, or Regions Fairly
Best for: Compare groups on consistent definitions rather than misleading raw totals.
Customize: Provide the segment field, metric, and normalization strategy.
Copyable ChatGPT Prompt
Compare {metric} across {segment_column} in the attached data.

Period: {period}
Key denominators: {orders_users_sessions_or_other}
Minimum group size if relevant: {minimum_n}

Calculate each segment's total, rate or average as appropriate, group size, and share of the overall result. Account for exposure/volume differences; identify groups with too little data for dependable interpretation.

Output: sortable comparison table, the largest meaningful gaps, assumptions, and 3 hypotheses to validate. Do not rank segments solely on raw totals if their sizes differ materially.
What to verify: Check segment counts and denominator consistency; avoid drawing strong conclusions from tiny sample groups.
Visualization & Reporting
Choose useful charts and explain the results to the right audience.
Prompt 11: Choose Charts That Actually Answer the Question
Best for: Match chart selection to analytical intent instead of generating a decorative dashboard.
Customize: Specify your decision question and key fields.
Copyable ChatGPT Prompt
Recommend the clearest charts for this spreadsheet and business question:
{business_question}

Available columns: {columns_or_inspect_file}
Audience: {audience}

Propose no more than 4 charts. For each, specify chart type, required columns, aggregation, axis labels, important filters, the question it answers, and risks of misinterpretation. Avoid pie charts for excessive categories, distorted axes, and dual-axis charts unless strongly justified.

If chart creation is available, generate the charts from actual data; otherwise provide build instructions. Do not invent numbers or claim to have rendered charts unless they were created.
What to verify: Inspect whether axes start appropriately, whether aggregation is faithful, and whether legends and units are explicit.
Prompt 12: Plan a Decision-Ready Excel Dashboard
Best for: Turn a messy workbook into a dashboard specification with KPIs and filters.
Customize: Define the audience, decisions, KPIs, refresh cadence, and supported Excel version.
Copyable ChatGPT Prompt
Design an Excel dashboard based on the attached workbook.

Audience: {team_or_role}
Decisions supported: {decisions}
KPIs: {metrics}
Refresh cadence: {daily_weekly_monthly}
Excel version: {version}

Review the available data before proposing widgets. Specify data preparation, KPI definitions, recommended pivot tables/formulas, charts, filters/slicers, layout order, and refresh dependencies. Include 3 data quality warnings the dashboard should display.

Output: a dashboard wireframe in text/table form, a build checklist, KPI calculation table, and validation plan. If direct workbook editing is available, ask before changing the original file.
What to verify: Test filters and refresh behavior, ensure all dashboard numbers reconcile to the source, and clearly label last refresh date.
Prompt 13: Write an Executive Summary Grounded in the Numbers
Best for: Translate technical findings into an understandable update for decision-makers.
Customize: Provide the spreadsheet or validated analysis, target audience, and reporting period.
Copyable ChatGPT Prompt
Write an executive summary from the attached spreadsheet or verified analysis.

Audience: {executives_managers_or_clients}
Reporting period: {period}
Primary business question: {question}

First identify and verify the 3 most decision-relevant findings. Use exact values, units, periods, and comparisons from the data. Separate facts, interpretation, uncertainty, and recommended next steps. Attribute each figure to its sheet/metric so it can be checked.

Return: 1 headline takeaway, 3 evidence-backed findings, 2 risks/limitations, 3 prioritized actions with owners to confirm, and a concise 120-word summary. Do not invent causes, targets, or numbers.
What to verify: Validate each headline number and ensure every recommendation is framed as an action proposal rather than a proven outcome.
Decision Making
Translate verified findings into priorities, experiments, and next actions.
Prompt 14: Identify Business Risks and Opportunities
Best for: Prioritize potential problems and upside using evidence, not vague “AI insights.”
Customize: Identify the business goal, priority metrics, and decision horizon.
Copyable ChatGPT Prompt
Use the attached data to identify business risks and opportunities relevant to this goal:
{business_goal}

Decision horizon: {time_horizon}
Metrics that matter: {metrics}
Constraints: {budget_team_or_other}

Find up to 5 risks and up to 5 opportunities supported by measurable patterns. For each, give the source metric, observed evidence, plausible business implication, confidence/uncertainty, and the next validation step.

Then rank candidates using stated criteria such as expected impact, urgency, data quality, and effort. Do not assign precise financial outcomes without a defensible model and assumptions.
What to verify: Review whether the ranking criteria reflect real business priorities and whether data gaps materially change the order.
Prompt 15: Turn Spreadsheet Findings Into Next Actions
Best for: Move from descriptive analysis to a decision brief with experiments and measurable follow-up.
Customize: Provide the validated findings, decision to make, available resources, and risk tolerance.
Copyable ChatGPT Prompt
Turn the verified findings in this spreadsheet/analysis into an actionable decision brief.

Decision to make: {decision}
Business goal: {goal}
Constraints: {time_budget_people}
Risk tolerance: {risk_tolerance}

Use only supported findings. Propose 3 options including a low-risk alternative. For each option, describe relevant evidence, main uncertainty, estimated effort (with assumptions), downside, expected signal of success, and a small reversible test where possible.

Return: Decision | Evidence | Options | Trade-offs | Recommended Next Test | KPI to Track | Review Date. Distinguish a recommendation from an action already taken. If evidence is insufficient, recommend what to measure next rather than making up certainty.
What to verify: Confirm decision ownership, effort assumptions, baseline KPI, and whether proposed tests can actually be run.
Excel Formula Examples Worth Checking
Formula prompts are strongest when you supply column locations and your Excel version. Here are illustrative formulas, not formulas computed from an uploaded workbook:
| Goal | Example Formula | Check |
|---|---|---|
| Sum revenue for a region | =SUMIFS(C2:C100,B2:B100,"West") | Column B holds the region and column C holds numeric revenue. |
| Find the product name by ID | =XLOOKUP(E2,A2:A100,B2:B100,"Not found") | Requires XLOOKUP support; check duplicate IDs. |
| Compute a change rate | =IF(B2=0,"",(C2-B2)/B2) | Format as percent; decide explicitly what a zero baseline should mean. |
These examples assume the shown cell layout. If your Excel installation uses different list separators or does not support a function, ask for a compatible version.
A Reusable ChatGPT Data Analysis Prompt Formula
Instead of memorizing all 15 examples, build a template from six pieces. It works for many Excel workflows:
TASK
Analyze {business_question}.

DATA
Use {workbook_or_sheet}, specifically {columns} for {period}.

DEFINITIONS
Use these KPI definitions and denominators: {definitions}.

CHECKS
Inspect missing values, duplicates, data types, and period completeness.

OUTPUT
Return {required_tables_charts_summary}. Show important calculations.

BOUNDARIES
Use only accessible source data. State assumptions.
Do not invent numbers, infer causality from correlation,
or modify the original workbook without approval.

VERIFICATION
Identify source columns, check totals, and disclose limitations.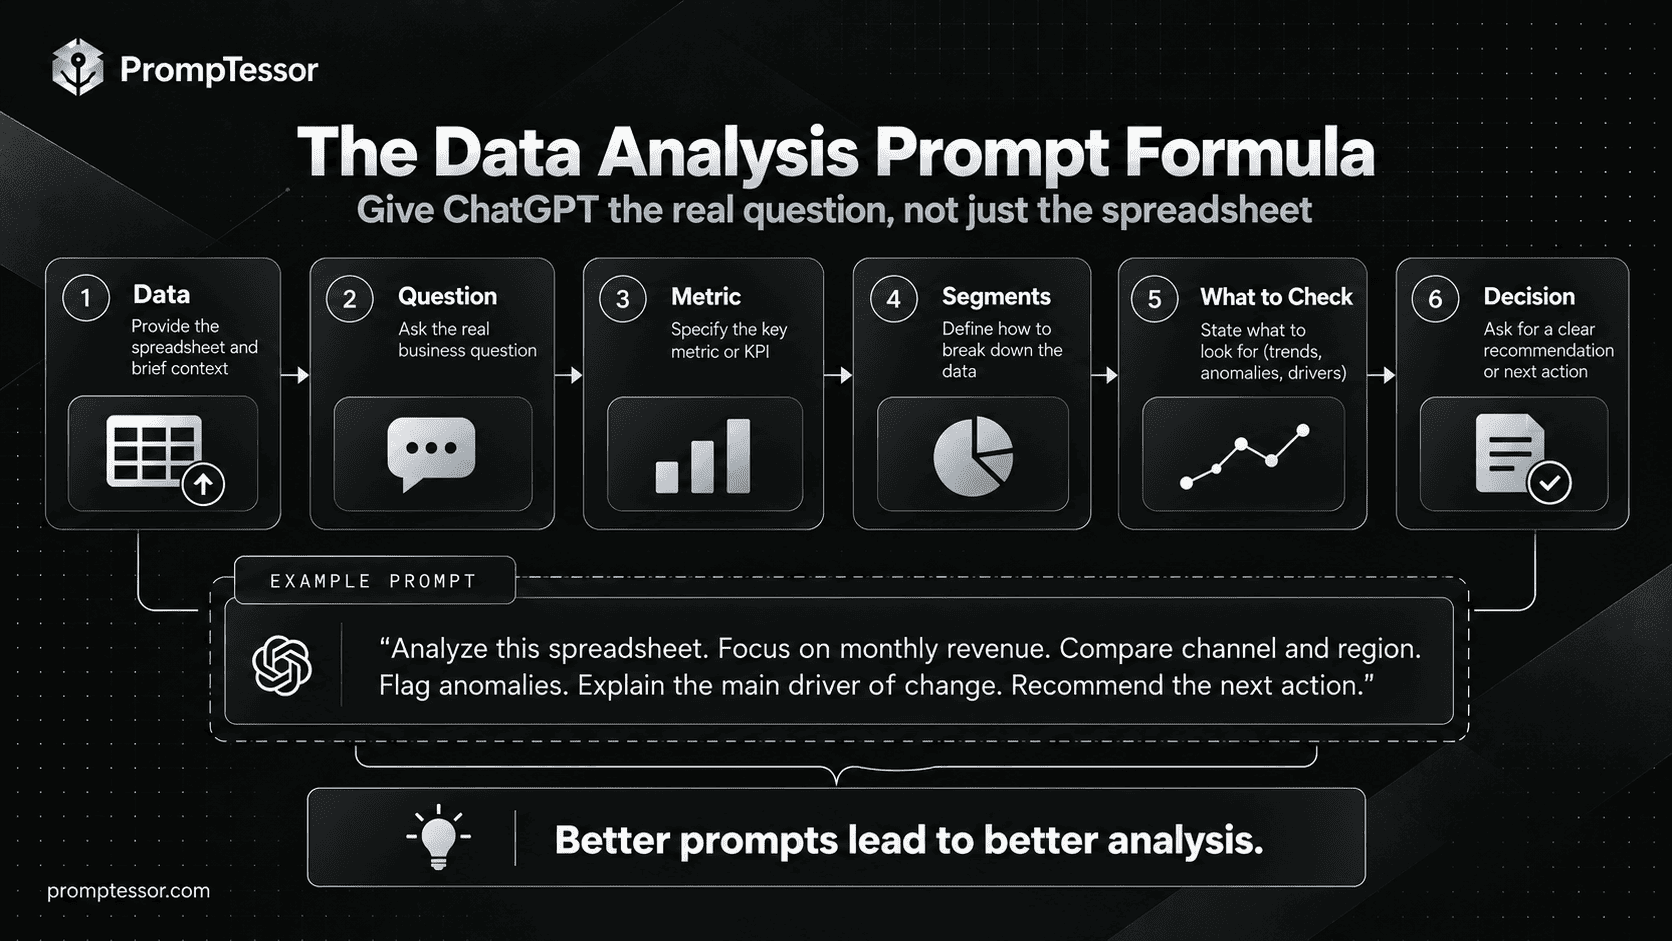
If you need prompts for different clients, dashboards, or recurring reports, save the stable structure and change only its variables. For a broader workflow, see AI Prompt Templates.
Common Mistakes When Prompting ChatGPT for Excel
1. Asking for “Any Interesting Insights”
Without a decision or metric, the response tends to be descriptive and unfocused. State what you need to know and why.
2. Skipping Data Quality
Duplicates, inconsistent categories, and missing periods can make polished charts tell the wrong story.
3. Leaving KPI Definitions Ambiguous
“Conversion” can mean leads-to-customers, visits-to-purchases, or another denominator. Define it.
4. Confusing Percentage Change With Percentage Points
A change from 3% to 4% is +1 percentage point, but approximately +33.3% relative change. Label which one you mean.
5. Claiming Causation From a Trend
The channel with the largest decline is a candidate for investigation, not automatically the cause.
6. Forgetting Verification
Spot-check a few calculations and rows. Ask for source columns, filters, units, and formulas. A confident explanation is not proof.
7. Overlooking Privacy
Review what customer, financial, employee, or confidential data your account and organization permit you to upload.
8. Expecting Every ChatGPT Session to Edit the Workbook
File upload, Python-backed analysis, workbook export, and in-Excel editing are related but distinct capabilities and may differ by account and workspace. Confirm what was actually generated.
How PrompTessor Helps You Create Better Excel Prompts
The examples above are useful starting points. But a recurring analysis task often needs a prompt tailored to your columns, definitions, audience, and decision. That is where an AI prompt workspace can help.
- Generate: Start with ChatGPT Prompt Generator to turn a rough Excel request into a structured, ready-to-copy prompt.
- Analyze: Use the AI Prompt Analyzer to spot missing context, unclear goals, weak constraints, or output ambiguity.
- Optimize: Use the AI Prompt Optimizer when the prompt produces inconsistent or generic analysis.
- Reuse: Save recurring prompt templates in the PrompTessor workspace and customize variables for each workbook or reporting cycle.
PrompTessor creates and improves instructions. It does not replace ChatGPT’s spreadsheet analysis engine, verify source transactions automatically, or guarantee that every calculation is correct. Continue validating the output against the actual workbook.
For general-purpose examples, explore Best ChatGPT Prompts for Work, Writing, Marketing, and Coding and AI Prompt Analysis.
Frequently Asked Questions
Can ChatGPT analyze Excel spreadsheets?
Yes. ChatGPT can analyze supported spreadsheet uploads such as XLSX and CSV files, inspect rows and columns, calculate metrics, and create tables or charts when those features are available for the account and workspace.
What is the best ChatGPT prompt for Excel?
The best prompt names the business question, sheet or file, relevant columns, metric definitions, validation checks, and expected output. Start with a data-quality audit when the workbook is unfamiliar.
Can ChatGPT write and fix Excel formulas?
Yes. Provide the actual columns or cell references, desired calculation, Excel version, example rows, and any errors. Test the generated formula against known cases before using it broadly.
Can ChatGPT clean messy Excel data?
It can inspect and propose transformations, and supported tools may create a cleaned file. Keep the original, review the proposed rules, and validate before-and-after totals.
Can ChatGPT create charts from an Excel file?
In supported data-analysis workflows, ChatGPT can create charts from uploaded data. Specify the metric, aggregation, grouping, and question each chart should answer.
Can ChatGPT be used directly inside Excel?
ChatGPT integrations for Excel or Google Sheets may be available in supported environments, but they require the relevant integration to be enabled; uploading an Excel file into ChatGPT is a separate workflow.
Should I trust ChatGPT calculations without checking?
No. Verify important figures against source rows, formulas, units, denominators, time periods, and independent spot checks. An explanation or chart can be plausible while the underlying analysis is wrong.
Are these ChatGPT Excel prompts free to use?
Yes. The 15 prompt templates in this guide are free to copy and adapt. Access to particular ChatGPT file-analysis features depends on the user’s plan, usage limits, and workspace settings.
Can PrompTessor analyze my spreadsheet directly?
PrompTessor helps generate, analyze, optimize, and reuse the prompt itself. Use a spreadsheet-analysis tool such as ChatGPT to work with the actual workbook and validate the results.
Conclusion
You do not need a complicated prompt to analyze an Excel file. You need a specific question, well-defined data, sensible checks, and an answer you can verify.
Start by checking the data. Use formulas and KPIs with explicit definitions. Explore trends and anomalies without confusing them with proven causes. Choose charts that answer a decision. Then translate the evidence into a next action or a question that still needs to be investigated.
Copy one of the 15 prompts, replace its placeholders, and test it on your real worksheet. When you need a reusable version for recurring analysis, use PrompTessor’s ChatGPT Prompt Generator to build a clearer template and refine it as your requirements evolve.
Official Sources and Further Reading
Build better prompts in one workspace
Generate prompts from ideas, analyze and optimize quality, refine with feedback, reverse-engineer content, and save reusable prompts in your Prompt Library.
Try PrompTessor Free